
The pandemic has caused hospital chaos. It didn’t have to be this way.
Health systems should be built to withstand shocks like this. Ours wasn’t.
 |
| Testing chaos: St Vincent's temporary clinic at Bondi, December 2021 |
Australia’s public hospitals didn’t stand a chance. For years, denied adequate resourcing by state and federal governments, they have been operating at or beyond their capacity.
When a shock came – it could have been a pandemic or anything else – there was no spare capacity. Quickly, the system was overwhelmed.
It was utterly predictable and utterly avoidable. Even now, though, there’s no acknowledgement by any government of the administrative and policy failures that caused all this chaos, pain and loss.
NOWHERE TO TURN
As the squeeze on resources tightened, hospitals tried to make up the gap by increasing efficiency. One of those measures is the average length of stay: if you get people out faster, you can make room for others without increasing bed and staff numbers.
It has its drawbacks. Patients who are discharged before they’re ready – “quicker and sicker” – are more likely to have to come back in, costing more overall. And others will take longer to recuperate, taking more time away from their normal functioning.
Australian hospitals can’t push this gambit much further. Of all OECD nations, only three have shorter average length-of-stays than our 4.7 days. In 29 others, it’s longer. (Japan’s is an extraordinary 16 days).

It helps no one to keep someone in hospital longer than they need to be there, so most countries have shortened their average stays.
In Australia, this trend has been happening for a very long time but seems to have reached its limit in the last decade. There’s only so far you can push this.

On the other hand, Australian public hospitals are put under more pressure than their international peers by a primary care system that fails to provide enough alternatives to expensive acute hospital care.
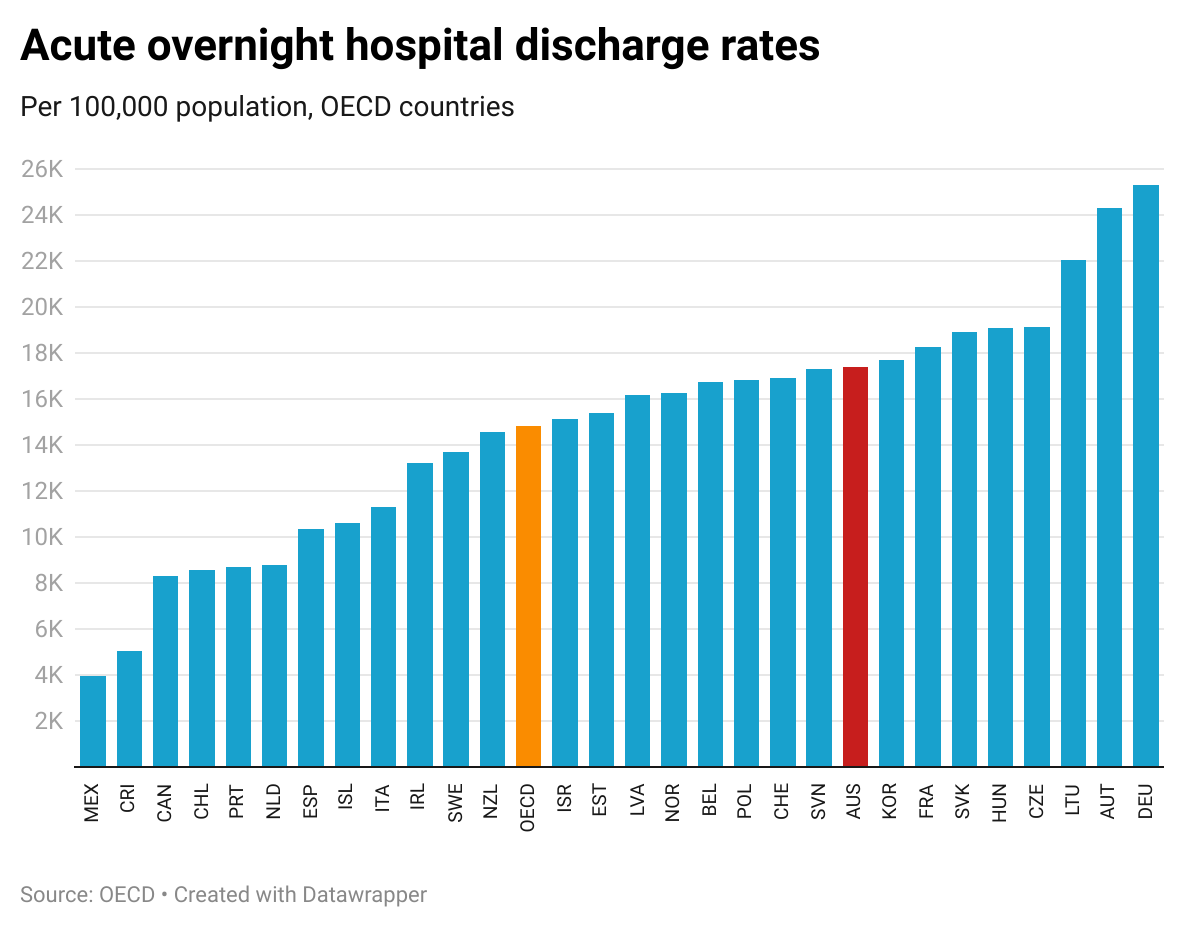
We have a significantly higher rate of hospitalisation than the developed-country average. This chart shows the proportion of people who spend at least one night in hospital for each of the OECD’s 28 member countries for which data are available.
Even before the pandemic, our hospitals were being squeezed from both sides – too few non-hospital alternatives and vanishing opportunities for further efficiencies.
… AND ALONG CAME COVID
For the pandemic’s first 18 months, the extra load on hospitals of Covid-19 patients was minimal. Problems were caused by restrictions, such as staff needing to isolate after close contacts, rather than by inpatient caseload.
When the restrictions were wound back, that all changed. The various Omicron waves, which could have been lessened with targeted, fairly non-disruptive measures like mandated mask-wearing in crowded indoor spaces, ran unchecked.

Hospitals, meanwhile, could not indulge in the free-for-all that now rules in the rest of the community. Preventing infection spreading from Covid patients to staff and other patients is a resource-hungry affair. Covid-positive staff had to isolate for long enough to avoid danger to vulnerable patients. Still, visitors brought the infection in.
The impact was not spread evenly across the country. New South Wales and the Northern Territory have been hard-hit; in Western Australia and Tasmania, though hospitalisations soared, retained some of the advantages of geographic distance.

THE IMPACT ON PATIENTS
Hospitals can no longer treat as many patients as they did before the pandemic.
As this chart shows, the number of patients on the wards (the technical measure is separations, or “completed episodes of inpatient care”) fell in the pandemic’s first year, largely because of mandated restrictions. But, everywhere except Victoria, there was a temporary bounce-back in the second year.
This is what it looked like from state to state.

It didn’t last. Elective surgery was usually the first to go, with operations increasingly restricted to emergency and urgent cases. Patients classified as non-urgent – though they may be living in significant pain and distress, with their conditions worsening – were too often neglected.
The following charts show how the post-restriction surge in Covid-19 affected non-urgent surgery in some major hospitals around the country. In Sydney’s Prince of Wales hospital, for instance, the abandonment of restrictions has resulted in 57% fewer non-urgent surgeries during 2021-22 than in the year before.

Victoria was much harder hit. No second-year bounce-back was possible in a situation of rampant infection and lockdowns. The number of patients having non-urgent elective surgery at the Austin Hospital in 2021-22 was only 36% as many as before the pandemic. It was 42% as many at the Royal Children’s, 32% as many at the Alfred and 64% as many at the University Hospital in Geelong.
As the chart shows, the declines in Victoria following the lifting of restrictions were apparently less dire than in NSW – but only because so much damage had already been done.

The rest of the country generally followed the NSW pattern: a decline in the pandemic’s first year, either a bounce-back or a levelling-out in the second, and a sharp decline in the third.


Tasmania has been deliberately left out of these charts because its figures were distorted by a one-off elective surgery blitz in which the state government paid for substantial numbers of mostly low-cost public patients to be treated in private hospitals.
Two of the quickest, cheapest elective procedures are treatments for cataracts and cystoscopy (which uses an endoscope to look inside the bladder). Before the pandemic, the chronic under-resourcing of Tasmanian hospitals meant treatments for these conditions almost always lagged demand. The state government has frequently met public criticism with well-publicised blitzes. For a time, it makes the figures look good; but soon things return to normal.

WHEN WE RUN OUT OF BEDS, PEOPLE DIE
The most revealing single measure of a hospital’s ability to cope with demand is the time patients needing admission are kept in emergency departments before a bed can be found for them. These patients need frequent attention and divert ED staff away from other patients, adding to overall waiting times, reducing efficiency and causing ambulance ramping.But this measure also reveals the seriousness of a hospital’s bed shortage. Patients needing admission, and who are kept in the ED for longer than a few hours, have a substantially increased risk of death.
Most Australian public hospitals experienced bed shortages long before the pandemic hit. But now, when too many doctors and nurses are not at work, when hard-to-manage Covid cases soar, and when demand overall continues its inexorable rise, sick and vulnerable people are left in emergency departments for far too long.
The measure of choice is the time waited in emergency at the 90th percentile for patients needing admission. Ninety per cent are admitted within this time but 10% remain.
This table shows the overall state-by-state results (hours:minutes) from before and during the pandemic. The worst results are in red; the best are in blue.

Around the country, there are 21 public hospitals where that 90 percentile time exceeds 20 hours. Of those, 11 are in NSW and two in Tasmania: in each case, this is far more than those state’s population share would suggest.
Most of these worst-affected hospitals are medium sized and
regional.

WHO’S MISSING OUT?
Elective surgery has usually been the first area to suffer when bed shortages become critical. This has happened everywhere, but the pain has not been evenly spread.
These are the figures showing the difference between numbers added to the official elective surgery waiting lists every year, minus the numbers removed from those lists. The main reason for removal is that the patient has been treated. But they may also be removed because they’ve gone private, moved to another city, or died.
The figures in red show where the backlog of cases has increased (more additions than removals) and those in blue show where headway has been made against backlogs.

But those official figures are seriously misleading.
Usually, the numbers added to waiting lists increases every year: in the five years before the pandemic, the average annual increase was 2.5%. In the past three years, though, additions have decreased. For many reasons, people needing care are not being added to the official lists. This may be because people have been staying away from the doctor (as they did in the early stage of Covid), because surgeons are too busy to deal with the outpatient clinics where people are commonly put onto the lists, or because doctors know there’s no point in trying at the moment.
To get an idea of underlying unmet demand – the real backlog – we need to factor in that usual 2.5% annual increase. And when we do, the result is very different. Again, increases in the surgery backlogs are in red and improvements are in blue.

WHAT ABOUT NEXT TIME?
For decades, medical organisations around the world have argued that any hospital with bed occupancy rates above about 85% will be less efficient, less safe for patients and more damaging for staff.
It’s much harder to control infectious diseases in a crowded hospital. And without good infection control, one person can unintentionally infect many others, potentially endangering their health and even their lives. That’s seldom been more true than it is at the moment.
When staff are overworked, their mental health suffers: use of anti-depressant medication has been clearly linked to overcrowding. And infection risk is not limited to patients.
As we’ve seen, bed block – where there aren’t enough available beds for those who need them – cause massive problems in emergency departments. And there’s strong evidence that a patient affected by bed block is around 30% more likely to die than would have been the case if a bed on a ward – and the specialist care that goes with it – had been available.
For many years, doctors have been urging governments to increase investment in hospital infrastructure and resources. And for just as many years, they have been ignored.
An effective health system should be able to handle a shock like the Covid-19 pandemic without producing universal chaos. We do not have such a system.
This will not be the last demand shock our public hospitals have to deal with. It would be foolish to hope we’ll be any better equipped then than we are now.