
How civilised? A scorecard of the 20 richest nations.
The wealthiest countries have no excuse for neglecting their own people. Here’s an assessment of the good – and the not-so-good.
 |
|
The United States is not, after all, the world’s richest nation. Luxembourg is. |
If you want to know how well-off a nation’s people are, the usual measure – GDP, or the total value of goods and services produced – is almost useless.
Which is richest? Finland or India? Belgium or Brazil? New Zealand or China?
India, China and Brazil have much bigger economies but they also have huge populations with millions living in serious poverty.
It’s much more meaningful to look at the size of each person’s share of national wealth – because that tells us what a country can do to improve the lives of its people.
This evaluation does not attempt to provide exhaustive data on every element of national economic and social policy. It tries, rather, to take key elements to provide an overview of how each of these rich nations treats its own people; and that, in turn, will give an insight into the way western civilisation is working in today’s world.
Throughout this study, data is the most recent available except when indicated otherwise. In some cases, datasets have been drawn from periods just before the pandemic to provide a more valid comparison between nations.
If you want to cut to the chase, the overall rankings are at the end.
CAPACITY
The 20 chart-toppers on this list hold a few surprises. Japan, India and China aren’t there. Americans are only the fifth richest national population. Of the 20, all but five – Australia, New Zealand, Korea, Canada and the United States – are in Europe. There are none in South America or Africa and only one in the whole of Asia.

These countries have the capacity to provide the world’s best living standards and public services to their peoples. Some do the job well. Others don’t.
But this chart gives us the first and most critical element of our league table – the means with which to provide a decent and civilised life.
Another important element determining a nation’s capacity to fund services is ratio of working-age, tax-paying people to the older, benefit-receiving population. Throughout much of the world, the number of productive younger people has been falling compared with the number of older people needing support.
Nations with younger populations have a significant advantage in their capacity to use tax money for services other than pensions and benefits. Why many governments do not take this advantage is another question.

DEMOCRACY
All of the 20 richest nations are liberal democracies. But not all have equally robust democratic institutions.
An example is the United States, which once liked to regard itself as a paragon of democratic practice but which lacks an electoral system capable of giving reliable expression to the will of the people. In the absence of overriding federal election laws, state legislatures are in charge. They can be captured by partisan interests which redraw electoral boundaries to suit themselves and to disenfranchise their opponents. Laws are enacted making it much more difficult for some, but not others, to vote.
The most frequently cited measure of the relative health of global democracy is compiled annually by the London-based Economist Intelligence Unit. The US is now regarded as a “flawed democracy” and is near the bottom of our 20-country list.

FAIRNESS
Money, says the adage, is like manure: it’s no good at all unless it’s spread around helping young things to grow. It’s a thought that ought to drive public policy everywhere.
No economy can achieve its potential if wealth is concentrated among too few people. People who are already rich tend to save extra income rather than spend it, so overall demand in the economy is suppressed. Because there’s less money for goods and services, companies produce less, make smaller investments and employ fewer people.
A greater the share of national income going to people who already have more than enough inevitably means there’s less for public services like health, education and childcare: when private providers dominate in these areas, people with less money miss out again.
So they are less healthy and less well educated, and parents stay at home to look after children rather than go to work. The whole economy become less productive, less fair and less cohesive. Everyone suffers.
The Gini coefficient is a standard overall measure of economic inequality. A country in which everyone’s income was equal would score zero; a score of one would mean one person got all the money and nobody else got anything.
The greatest inequality is often to be found in developing countries, where great wealth exists alongside great poverty. The world’s least equal country, South Africa, has a Gini coefficient of 0.63.
Even in the 20 richest countries there is considerable variation, both within nations and between each other. The difference between Norway and the United States is striking.

Another way of looking at the same thing is to measure how much more the income of a country’s top 10% exceeds that of the bottom 10%. Again, the Nordic countries stand at one end and the United States – followed by Britain, Canada and Australia – at the other.

Nations that discriminate against women in the workplace deprive themselves of the full productive capacity of slightly more than half their populations. One indicator is how much women are paid. The more they are integrated into the workforce – and that implies having a suitable share of well-paid jobs – the more productive that economy is likely to be.
Cultural norms are important here. Europe has moved more strongly than the Anglosphere in gender equality but the standout is Korea.

Unaffordable childcare costs are a powerful force in keeping parents, particularly women, out of the workforce. Too often, this is worsened by government policies which fail to take childcare fees into account when setting the rates of tax and benefits. In Australia, Denmark, New Zealand and Canada, parents who want to work face the loss of more than 70% of their earnings in increased tax and lower benefits, on top of childcare costs.

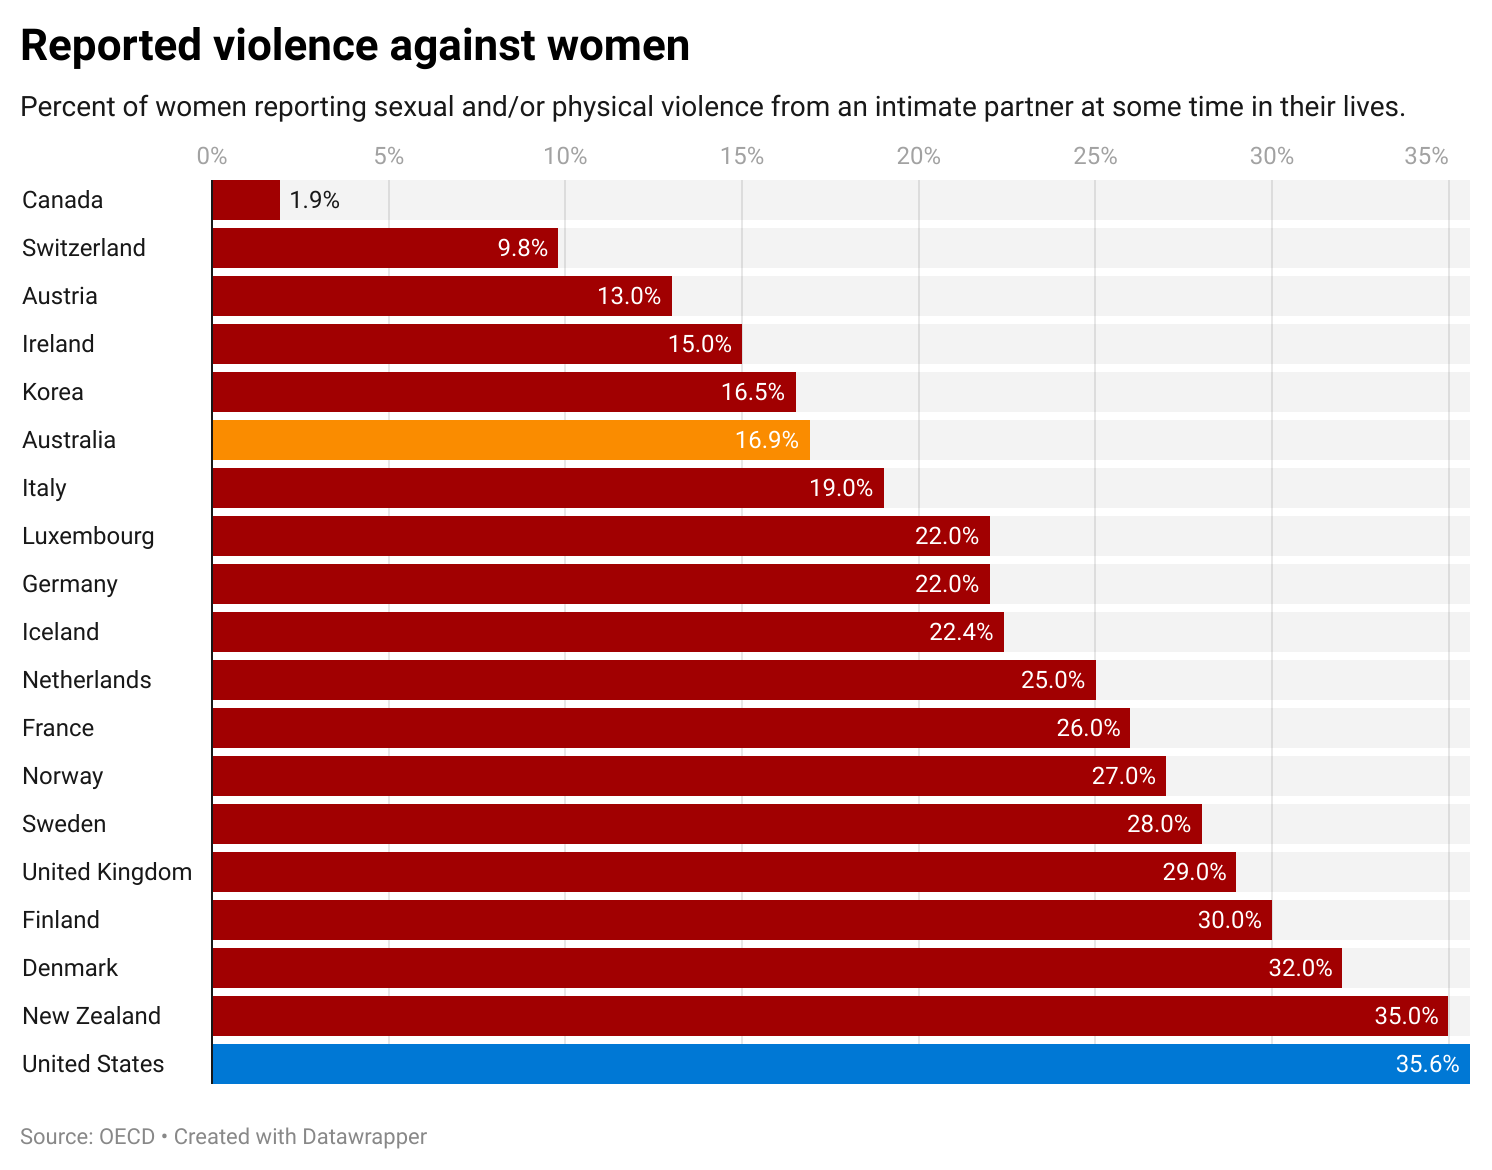
There are limits to what governments can do about domestic violence, but recognising it as a problem is the first step. As the following chart shows, there is no obvious relationship between economic wealth (GDP per capita) and levels of violence. Rather, this violence seems to reflect much deeper cultural and economic forces in the society.
A couple of caveats: the figure for Canada, 1.9%, is too low to be credible; and these figures depend on violent incidents being reported and collated.
FAIRNESS
Top five: Korea, Iceland, Finland, Austria, Norway.
Bottom five: New Zealand, Britain, United States, Denmark, Australia.
SOCIAL JUSTICE AND THE ECONOMY
Welfare payments account for a large part of government budgets in most developed countries. The desire by political leaders to limit or reduce this expenditure is perhaps understandable but well-targeted welfare programs allow poorer people to have a decent life and to feel their country has a place for them. These payments also contribute powerfully to economic demand: poorer people have little choice but to spend what they earn.
Again, there is a split between the nations of northern Europe and the United States, Canada, Australia, New Zealand and France.

For those in employment, low wages have a similar impact to inadequate welfare programs. An underclass of the working poor may – in the short term – benefit wealthy company executives and shareholders but at the cost of social cohesion, common decency and longer-term economic growth.
Again, there is a clear disparity between the nations of northern Europe and those which model their economies more on the example of the United States.

Another question is whether people can live decently on the minimum wage. That’s answered by the number of hours worked every week it would take to lift someone above the poverty line. Data are available for only 12 of our 20 nations but they show the difference between countries with regulated wage-setting systems and those without.
Australia has had a minimum, or basic, wage set by an
independent arbiter, since 1908. It’s currently at $A21.38 an hour (equivalent
to $US14.92). The US also has a nationally mandated minimum wage: $US7.25 an
hour ($A10.39).

Moving up the income scale creates a very different picture. The median wage (50% earn less and 50% earn more) shows people in the middle are much more likely to benefit from their nation’s economic strength than the working poor and those living on welfare.

THE ROLE OF GOVERNMENT
No government in any developed country, whether of left or right, follows pure capitalism or pure socialism. No government (at least out loud) advocates the privatisation of defence, police or border control. Nor are they likely to advocate nationalisation of supermarkets, car dealerships or agriculture. But there’s a colossal gap between those two extremes, so the balance between private and public ownership of the means of production, distribution and exchange remains the great issue of economic policy.
The areas that are most likely to be left to governments are those essential services that everybody needs (health, education), natural monopolies (communications, roads, electricity, water) and those in which it’s difficult to make a profit (public transport infrastructure, long-distance power distribution).
The past half-century saw a rush toward privatisation that, in many instances, have failed to provide adequate services, appropriate capital investment. Now the pendulum is swinging the other way. Further large-scale privatisation has become politically toxic and enterprises that were once privatised are sometimes now being returned to government hands.
Most government spending, though, is in welfare, pensions, health, education and public infrastructure. If these are inadequately funded, people who cannot afford private alternatives are inadequately served: overcrowded hospitals, inadequately staffed schools, run-down universities, potholed roads and unsafe bridges. Depending on the level of under-funding, significant sections of the population are denied the chance to achieve their potential and their contribution to the society and the economy is reduced. Poor education and inadequate income are strongly associated with increased crime, domestic violence and social dislocation.

It is true, of course, that government spending can be wasted: over-generous pensions and benefits, or inefficiently run services. High welfare spending, for instance, is partly responsible for the very high rate of government expenditure in France, but other services are also well funded.
Countries outside of mainland Europe raise far more of their tax revenue from individuals rather than from the corporate sector. The following chart shows the varying balance between who pays for the state.
.png)
On this measure, northern Europe again dominates.
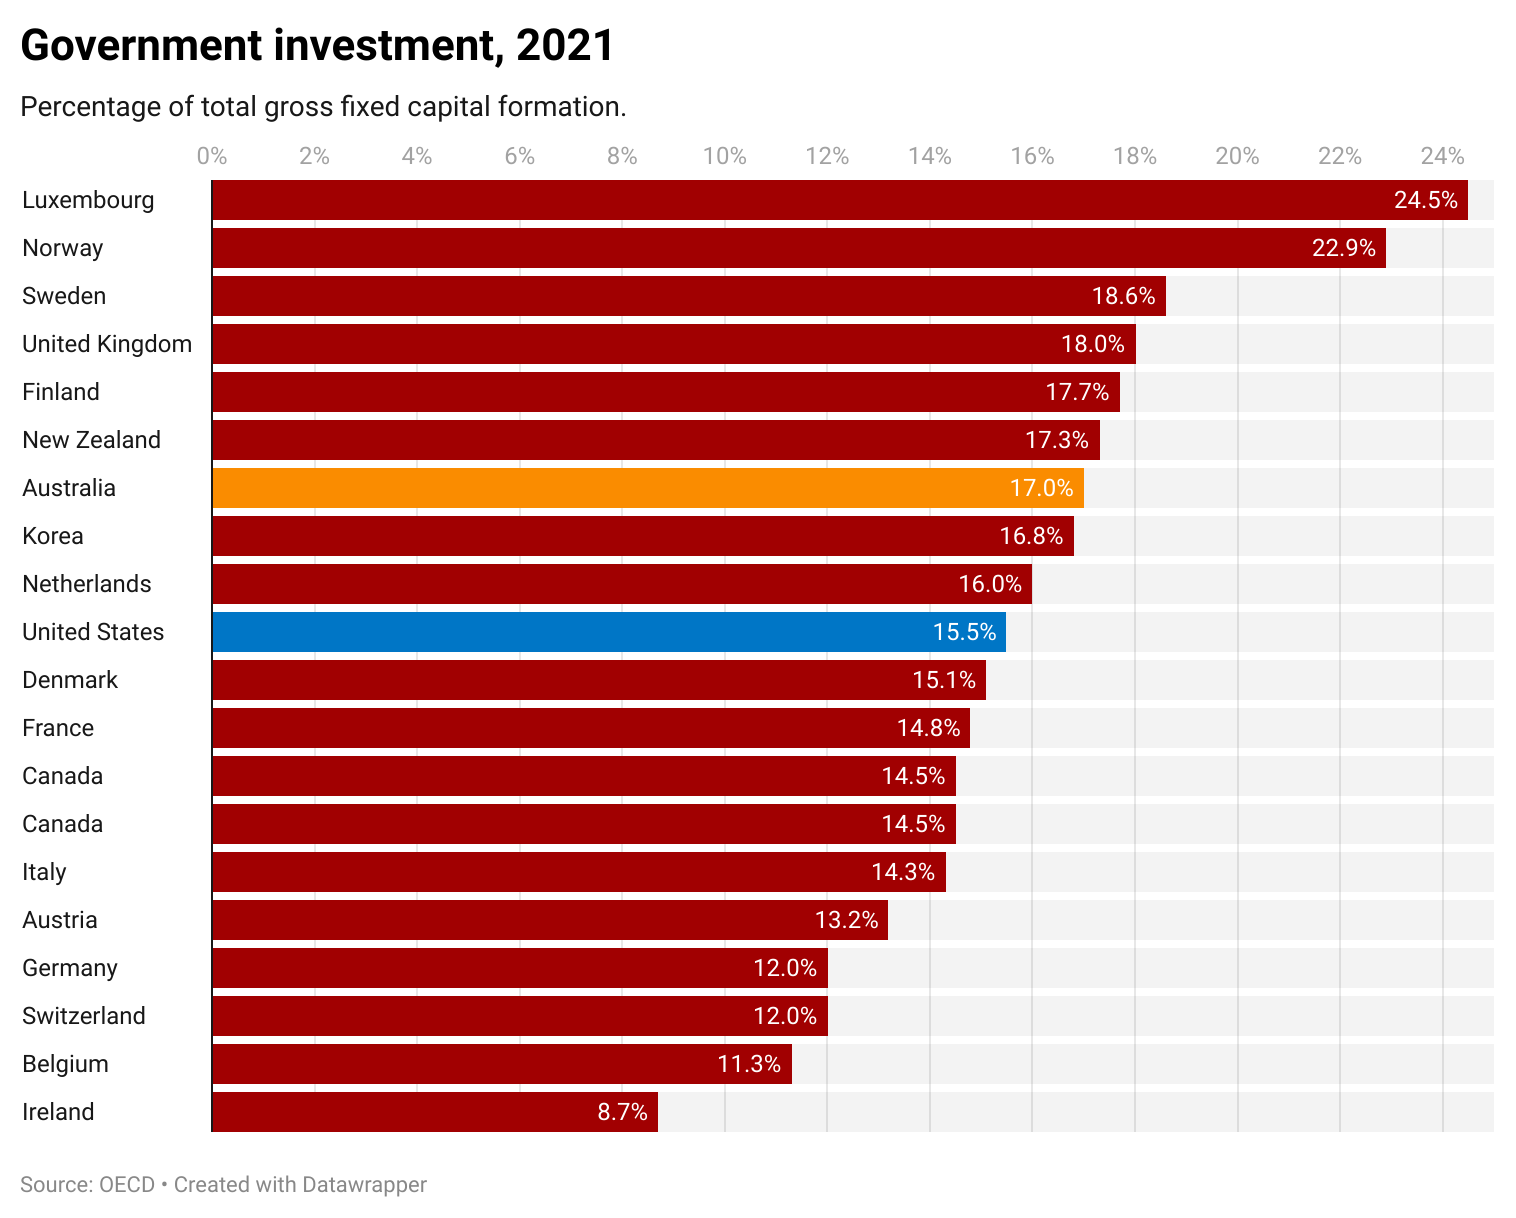
The figure for the United States includes military spending: as the US spends far more than any other nation on its military hardware, this chart does not represent the relative paucity of America’s investment in civil infrastructure.
“Public investment in U.S. infrastructure as a share of GDP”, said the Biden White House in a media release, “has fallen by more than 40 percent since the 1960s. The World Economic Forum now ranks the United States 13th when it comes to the overall quality of infrastructure.
“Governments have long understood that investments in basic infrastructure support economic activity. Crumbling roads and delays on trains, planes, and public transportation make the transport of people and goods harder and longer. Slow broadband hurts businesses and workers alike who depend on the internet for work.”
HEALTH
A strong economy and high health spending should ensure a better health system – but it doesn’t. The most comprehensive assessment of the world’s 190 national health systems was published by the World Health Organisation in 2000, drawing on data from 1997.
Of our 20 richest developed nations, the United States spent the most but was judged to have the third-worst healthcare. France was judged to have the most effective system but was fourth on the spending list. Although healthcare is expensive everywhere, funding alone is not an indicator of effectiveness.
Nor does a reliance on public funding produce any discernible difference. There is no perceptible relationship, among these 20 countries, between the proportion of health spending which comes from public rather than from private sources, and health outcomes.
The exception is Korea. Below a certain level of funding, no health system can function adequately. Korea is now, and was then, one of the world’s richest countries. It can afford a much better and more equitable health system than the one it has and, according to other indicators, still has.

According to the WHO assessment, “Although significant progress has been achieved in past decades, virtually all countries are under- utilizing the resources that are available to them. This leads to large numbers of preventable deaths and disabilities; unnecessary suffering, injustice, inequality and denial of an individual's basic rights to health.
“The impact of failures in health systems is most severe on the poor everywhere, who are driven deeper into poverty by lack of financial protection against ill- health, the report says.
“The poor are treated with less respect, given less choice of service providers and offered lower- quality amenities. In trying to buy health from their own pockets, they pay and become poorer.”
The WHO assessment relied on data that’s now 25 years old.
But more recent data indicate that not all that much has changed. There’s at
best a weak relationship between health spending and life expectancy. When we
remove the main outlier – the US, which has high spending and low life
expectancy – the only relationship is that higher life expectancy and lower
health spending seem to go together. It's a confronting and confounding finding, but it again indicates that the way money is spent is more important than the amount that's spent.

Overall rates of life expectancy in developed nations have improved dramatically in the past century. Only in the United States has there been a significant downturn: after reaching 78.9 years at birth in 2014 – still a developed-country low – it fell to 77 in 2020. This appears to be only partly due to the pandemic. Italy, which was even harder hit by Covid-19 than the US, showed no significant downturn.

Effectiveness in health policy still depends – within reasonable parameters – much more on how the available money is used than on how much is spent. Any system in which patients face high out-of-pocket expenses at the point of service provides a strong disincentive for less-wealthy citizens to seek necessary medical care.

Although rates of infant mortality in developed countries are now low, they remain an indicator of the effectiveness of health systems and of the society generally to provide adequate conditions for maternal and infant welfare. The high rate in the United States is another symptom of a health system and social structure which benefits the rich (and the ultra-rich) at the expense of a mass of people at the bottom of the economic ladder. But other countries can take no comfort from these data either.

Obesity is a major health problem that greatly increases the risk of diabetes, heart attack and stroke, breast cancer and bowel cancer.

Within most developed countries, obesity tends to be concentrated among people with the lowest socio-economic status. There’s a relationship, then, between obesity and economic inequality. Again, the United States is an outlier not included in this chart. If it was, the relationship would appear stronger.

The emergence of new but expensive drug treatments for obesity presents another challenge for governments and their health systems. The people most affected by the condition are mostly poor; those who can afford the treatments are mostly rich.
Countries without robust systems of universal health care – which treat patients on the basis of need rather than wealth – will be unable to cope.
Industrialisation has created the wealth of all the nations on our list, but at a price. The most heavily industrialised also have the worst environmental records, not only in greenhouse emissions but also in the long-familiar curse of environmental pollution. One of the most lethal to humans is microparticulate air pollution.

The US Environment Protection Authority says this:
“An extensive body of scientific evidence shows that exposure to fine particles can cause cardiovascular effects, including heart attacks, heart failure, and strokes, which results in hospital admissions, emergency department visits, and, in some cases, premature death.
“The scientific evidence shows exposure to fine particles is also likely to cause respiratory effects, including asthma attacks resulting in hospital admissions and emergency department visits, reduced lung development in children, and increased respiratory symptoms such as coughing, wheezing, and shortness of breath.
“There is more limited scientific evidence for a broader range of health effects associated with fine particle exposure (e.g., developmental and reproductive effects, cancer).”
Top five: Iceland, Norway, Sweden, France, Italy.
Bottom five: United States, Canada, Belgium, Britain, New Zealand.EDUCATION
Education inevitably costs money, but all the 20 rich nations in our list have enough money to provide high-quality education to their whole populations. Once again – with the exception of the US – English-speaking countries perform less well in school education than their European counterparts. Australia, Canada, Britain and Ireland all have much less well-educated populations than the average of the 20 nations.

But when we look at student achievement, a somewhat different pattern emerges. The standouts are Korea and Canada, which lagged historically in school education but have now moved ahead of their rivals.

Once again, though, there is no relationship between the amount of money spent on school education and the measurable effectiveness of teaching and learning.

Nor does it seem to matter whether governments provide a greater or lesser share of funding. There is no statistical relationship between the proportion of public versus private funding and overall student attainment.

Several of the nations with the lowest level of tertiary qualification among their young adults – Finland, Germany, Iceland, Denmark – also provide a high proportion of total tertiary funding from public sources. Australia, the United States, Britain and Korea rely far more on non-government funding, most often in the form of repayable student loans.

It is perhaps a disappointing result for advocates of government funding, but there is actually a negative relationship between reliance on public funding and academic results, as this scatter-plot chart shows.

As with health, the amount of money – within reason – is much less important than the way that money is spent. If too much of the available funding is spent on wealthy people who are in less need, at the expense of the disadvantaged, it is to be expected that overall results will suffer.
But there is a vast difference in the way nations use the resources of their younger citizens, whatever their qualifications. There is a massive social and economic cost for young adults to be without either work or study. In this, Germany, Switzerland, the Netherlands and the Nordic nations have a far better record than Britain or the United States.

BUT ARE YOU HAPPY?
Several systems attempt to measure population-level happiness and life satisfaction. The one with the most comprehensive coverage is the World Happiness Report, an initiative of the United Nations.
Overall, it shows that people in rich countries have far higher levels of satisfaction with their lives than those in middle- or low-income nations. But national wealth alone is not enough. Much depends on the way a nation treats its people.
This list shows the results for our 20 richest nations.

HAPPINESS
AND THE WINNER IS …
As perhaps expected, the Nordic countries scored well overall. Of the five countries that scored highest averages, all – Norway, the Netherlands, Finland, Sweden and Luxembourg – were in northern Europe. Australia came ninth.
The United States is the fifth richest country on our list (measure by GDP per capita): if its government institutions and social programs operated at the average level, it would score far higher than eighteenth out of twenty.
Belgium, Italy, France, Britain and Korea also scored very poorly. It’s a result that calls for clear reform of governance in those countries. They are all rich enough to do much more than they do to enhance the lives of their people.
