
Which state has the worst housing crisis?
The crisis is everywhere – and it’s the result of decades of deliberate neglect and failed ideology. This analysis reveals how each state rates, from the least-bad to the worst.

Three years ago, homeless people set up tent settlements outside the Reserve Bank in Sydney and Flinders Street Station in Melbourne.
In Melbourne, police dismantled that city’s camp. Sydney’s Lord Mayor, Clover Moore, took a more humanitarian approach and negotiated to find public housing for the tent-dwellers of Martin Place.
The protest camps drew national and international attention to Australia’s housing crisis but in the three years since, little has happened. But these issues did not suddenly appear. Rather, they have their origins in decades of neglect and failed public policy as politicians, ensnared in the small-government, free-market fashions of the time, retreated from their roles in ensuring the economy worked for everyone, not just a fortunate few.
The housing crisis is largely the product of over 40 years of neoliberal economics.
Australia, on a population basis, is the eighth richest country in the world. If the basic human right of secure and adequate housing cannot be ensured here, where can it be?
The tendrils of our persistent housing crisis extend almost everywhere but not everyone is equally affected. The standout jurisdiction, in this as in so many other social-justice issues, is the Northern Territory. Its statistics are so many times worse than anywhere else that it makes comparisons almost meaningless.
So, to make sense of this exercise, we have to take the Territory out of consideration – while not forgetting the intractable disaster that affects its indigenous people throughout their lives. An examination of the complex issues surrounding aboriginal housing are far beyond the scope of this analysis. But the other jurisdictions, particularly in the capital cities, are close enough to make valid comparisons.
Every element of the crisis is connected to every other. It begins with the people no longer able to afford to buy a home being forced into an overheated rental market. In turn, renters are forced out, depending on social housing as the only affordable option. But because government commitment to social housing has been falling for half a century, there is no room for many of those who need it. And so homelessness, too, is experiencing a boom.
This analysis will follow the chain of dysfunction from the bottom up, starting with the homeless. It will score the six states and the Australian Capital Territory across a range of criteria, broadly under four headings: homelessness, social housing, rents and mortgage debt.
HOMELESSNESS: THE SHARP END OF A CRISIS
Of all those affected by insecure housing, those sleeping rough are the most badly afflicted. As the census data shows, the proportion of the population sleeping rough has barely moved in 15 years. Many of these people have serious health and mental health problems and have been comprehensively forsaken by services that are not there to help them.
In 2021, rough-sleeper rates ranged from 1.2 per 10,000 population in New South Wales to 8.7 in Western Australia. The relatively high levels in WA and Queensland can be attributed to the higher proportion of indigenous people in those states.

Overall homelessness rates have increased over the past four census periods. According to the 2021 census, the range was from 36.6 in WA to 47.1 in Victoria. The worst performance over the four census periods was in Tasmania, where the rate rose from 24.1 in 2006 to 42.1 in 2021.

Across the country, population-wide rates of homelessness
range from Victoria’s 5.2 per 10,000 above the national average – the worst –
to 5.3 below in WA, the least-bad.

One of the most worrying aspects is the number of homeless
children. Kids who are denied a stable home-life tend to take that sense of
dislocation and alienation with them throughout their lives. It can be
profoundly damaging. The number of homeless young children, aged under 12, is
particularly disturbing.

For all children – aged 18 or less – South Australia has by far the worst result.

Throughout this analysis, states will be rated on a seven-point scale, with 7 as the worst and 1 as the least-bad. These will then be amalgamated at the end and with an overall score based on the averages.
For performance in dealing with homelessness, Victoria ranks as the worst (5.25/7) and the ACT the least-bad (2.00/7).
THE FAILURE OF PUBLIC HOUSING
The lack of public housing is not the only cause of homelessness but it is a substantial one. Only when we look back over half a century do we realise how governments around the country have abandoned a responsibility they once saw as central to the purpose of governing.
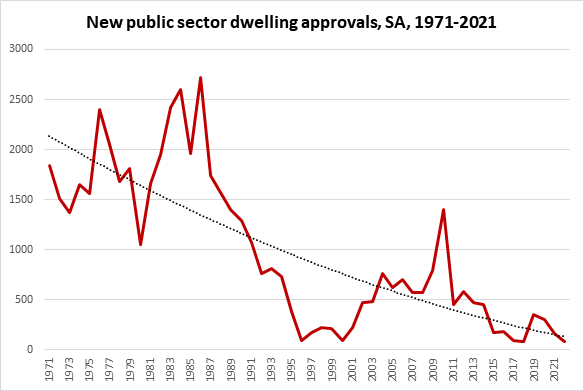
The 1960s and 1970s saw a huge effort in building housing for economically disadvantaged people who could not find or afford private sector accommodation. In 1971 alone, 15,563 public-sector houses and flats were approved around Australia. In 2021 that had dropped to 3,665 – just 24% of the level of 50 years before. And in that time the population had almost doubled.
The following series of charts shows what happened, when it happened and where it happened. The neglect of public housing was universal, though not evenly spread.


With the increase in population, the need for public-sector housing has increased. Again, though, that increase is not spread evenly around the nation.

This is what it means on a state-by-state level: comparing the average of the first five years (1971-75) with the most recent five years (2016-21). The decline in the rate of new public housing, measured against the population, ranged over the 50 years from 2,370% in the ACT to 261% in Victoria. (The ACT has a partial excuse: in 1971 Canberra was still being established with large numbers of public servants being moved to the national capital).

In all states, the provision of social housing has continued to fail to meet growing needs. In its most recent report the Australian Institute of Health and Welfare noted that:
“While the number of households in social housing has increased over time, and in all states and territories, it has not kept up with the growth in the overall number of households in Australia. The proportion of social housing households making up the total proportion of Australian households has steadily declined since 2011, from 4.8% to 4.2% in 2021.”
This chart shows what has happened nationally over the past decade:

Victoria, despite its “big-build” program, is clearly the least capable jurisdiction. But, as the AIHW says, the problem is everywhere.

The forces driving Australia’s housing crisis – inflation, falling real wages, population increase and shortfalls in housing supply – put more and more people into stress and, potentially, homelessness. The only safety-net is public housing, and that safety-net is failing.
The number of households on public housing waiting lists rose from 43,200 in 2014 to 67,700 in 2021, an increase of 57% in just seven years. State housing authorities are struggling to house even the most urgent cases, which they classify as “greatest needs” households. These are people who are homeless or at risk of homelessness, including:
- Life or safety was threatened within existing accommodation
- A health condition was exacerbated by existing accommodation
- Their existing accommodation was inappropriate to their needs
- They were experiencing very high rental costs.
In 2021, 41% of these households had to wait for longer than six months to obtain urgently-needed accommodation. Data are not available on a state-by-state basis but it is reasonable to assume that the jurisdictions with the greatest shortfalls in public and social housing – Victoria, but also Queensland and Western Australia – are responsible for the worst outcomes.

For anyone not in the most urgent categories, waiting times
are even longer, with 59% having to wait for longer than a year.

For the provision of adequate public housing, NSW and Queensland are equal-worst (5.67/7) and Tasmania the least-bad (2.67/7).

THE RENTAL SQUEEZE
Rent revenues generally fell during the pandemic as the economy tanked and immigration ceased. With the re-emergence of more normal conditions, they began to rise again. In the places most severely affected by lockdowns, such as Sydney, Melbourne and Perth, an increase in rent revenue was inevitable.
But increases occurred also in places that had no significant pandemic downturn. In Hobart, rental revenue is now over 25% higher than it was five years ago.

The Rental Affordability Index, calculated independently by SGS Economics and Planning, shows what happened in the capital cities over the decade to 2022. A household spending 30% of its income on rent has an affordability score of 100; less than that means rents are unaffordable.

Before the pandemic, rents in the three major capitals varied from “moderately unaffordable” to “acceptable”. Then, during the Covid recession, they became temporarily much more affordable before returning towards their previous levels. The data behind these calculations is now between one and two years old.


Even when the data behind these calculations was collected, someone on Jobseeker would have to spend more than their entire income to rent a median-priced property in Sydney, Perth and Canberra. All people on government benefits would have experienced significant to severe financial stress.

Since then, median rents have increased rapidly, with the most recent CoreLogic data showing an acceleration. Rent hikes, which typically occur annually as new tenants move in or landlords increase the rent for existing tenants, are massively greater than could be justified by recovery from the pandemic recession. Unit rents are disproportionately affected.

As overseas migration has returned and as more people are finding it impossible to buy their own homes, pressure on the rental market has soared.

The inner cities are the most savagely affected, with median weekly rents in inner Sydney and inner Melbourne rising by a quarter in a single year, though vacancy rates remain mostly a little higher than for the city-wide figures. The data in the following table are for all dwellings.

Vacancies are at near-historic lows. Pricing power has been decisively transferred from renters to landlords.

Because most rental agreements are re-set annually but not all at the same time, there is a time-lag before new levels become universal. A general rise, such as the 26% increase in inner-Sydney rents, does not hit all at once. It will take up to a year to affect everyone – and by then, the cycle will have started again.
The projections in the following table take that lag factor into account to assess where median capital-city rents are likely to be this time next year. It also shows how those rents will compare with average wages.

There are many causes of the rental crisis but the rise of short-stay accommodation is certainly one of them. There is little transparency in this area so comprehensive, timely data are not available. Researchers from Sydney University examined the impact of AirBnB on rental vacancies in Sydney in 2015.

They found a concentration of short-term rentals in the inner-city and beachside suburbs. In the Sydney City Council area, whole-of-home AirBnB accounted for 9.6% of all rental properties and 24.2% in Waverley, which covers Bondi, Bondi Beach, Clovelly, Bronte and Tamarama.
Taking this number of properties out of the long-term market inevitably has a massive impact on rents and availability. If just 50% of AirBnB whole-of-home listings had been returned to the long-term market, vacancy rates in the City of Sydney would have increased from 2% to 6.8% and in Waverley from 2% to 14%.
More recently, the same researchers examined the impact of AirBnB in Sydney, Melbourne and Hobart. They found Hobart was substantially more affected than the two biggest cities.
In greater Hobart, AirBnB listings accounted for 5.7% of the entire rental market; the long-term vacancy rate was 2.2%. If 50% of AirBnB properties had been returned to the long-term market, the long-term vacancy rate would have gone from 2.2% to 5%.
As we’ve already seen with the 2015 results in Sydney, tourist-centric districts are disproportionately affected. In the Hobart City Council area, converting 50% of AirBnB properties from short-term rental to long-term would have increased the vacancy rate from 2.2% to 6.9%.

Another cause of the rental crisis is the high number of unoccupied houses and units. Across the country, 9.6% of all private dwellings were unoccupied at the time of the 2021 census. There are many legitimate reasons for some properties to be temporarily vacant but these figures are far higher than they should be. Nor is the problem equally distributed across jurisdictions: Tasmania has the worst result.
If a relatively small proportion of these dwellings were put onto the long-term rental market, vacancy rates would immediately improve and rents would stabilise or fall. At least in principle, fixing this problem could fix the crisis.

There are two kinds of rent: the one we’ve been talking about here and “economic rent”, which is (usually) quite different.
Economic rent is profit in excess of that which would be earned in a perfectly competitive market, where supply balanced demand and sellers and buyer had similar power and information. It’s often described as windfall profits, such as those currently enjoyed by the mining industry and the big banks. Economic rent is inherently unfair and damaging. It’s a classic instance of market failure.
The low vacancy rates and high rental hikes in the residential tenancy market are a clear and egregious example. When important markets fail, the appropriate response is for governments to step in. Saving capitalism from itself is their job.
There is now an overwhelming case for imposing temporary caps on rents, and for limiting further increases to the sort of level that would be found in a properly-balanced market. There is also an overwhelming case for reducing short-stay accommodation in places where it is doing too much social damage to be tolerated any longer.
On ensuring an affordable rental market, the biggest failure is South Australia, with a score of 5.

THE RISE IN MORTGAGE DEBT
In spite of it all, Australia remains a nation of home-owners, not renters. Over the past 25 years, the proportion of renters has risen and of owners has fallen, but not by enough to change the fundamental picture. And the slow trend from owning to renting has happened slowly and fairly evenly over at least 25 years. This is not a new phenomenon.

That’s the big picture. Most owners either own their home outright or have a mortgage signed long ago, when prices were cheaper. For people trying to enter the market, it’s different.
The change from owning to renting has happened overwhelmingly among younger people. Just look at the data on first-home buyers. In 1993, 22% of all purchases nationally were of a first home. By 2018, 25 years later, that had fallen to 17.4%.
And in some states – Victoria, South Australia, Tasmania –
the decline was even greater.

Here’s why. In 25 years, housing costs rose by 37% in real terms. Most of that happened in the first decade of the new century.
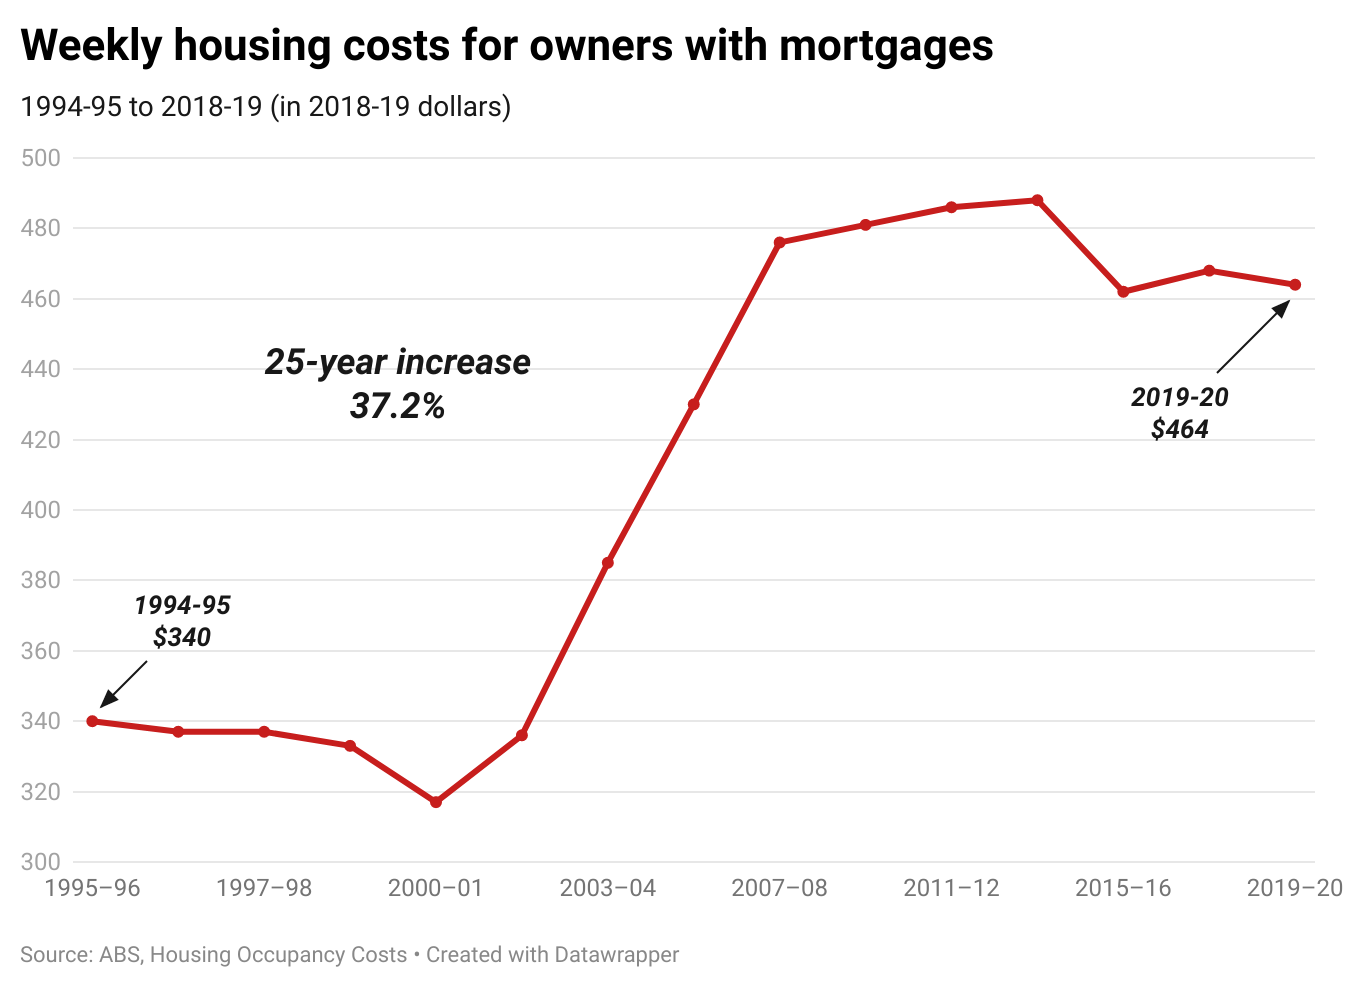
Here’s another way of looking at it. People with mortgages
are paying much more in real terms. New South Wales, Victoria and Tasmania are
in the lead.

Over the 25 years from 1993 to 2018, national house prices rose by an average of 6.8% and unit prices by 5.9%. And as prices rose, wages fell further behind. Over the 25 years, annual inflation-adjusted earnings rose by just 2.2%, so buying somewhere to live took an ever-greater proportion of household spending.


Percentage increases strike harder in places where prices are already high. The percentage increases for both houses and units were lower in Sydney than in Melbourne but Sydney’s dollar increases were substantially higher. It’s largely the reason that the crisis hits hardest in the biggest, most expensive cities.
Because prices have risen so much faster than incomes, mortgages take longer to pay off. So the number of people still paying off a housing debt has increased, while the number who own outright has fallen.

The squeeze on home-buyers is not a sudden phenomenon. It has been happening for decades as the power of workers to negotiate pay increases has been eroded and capital’s share of economic output has increased at the expense of the labour share.

The recent increases in mortgage interest rates are
significant not because they are historically high  (they are not) but because
they come at a time when the capacity of many households to absorb almost any
extra cost has vanished. Increasingly, people are forced to relocate to outer suburbs and bear the costs of commuting long distances. Travelling can add three or four hours to a working day and the costs of fuel and toll roads are an added serious strain on household finances.
(they are not) but because
they come at a time when the capacity of many households to absorb almost any
extra cost has vanished. Increasingly, people are forced to relocate to outer suburbs and bear the costs of commuting long distances. Travelling can add three or four hours to a working day and the costs of fuel and toll roads are an added serious strain on household finances.
Again, though, these costs have not struck evenly. The price of living in our inner cities, close to workplaces and facilities, is now unaffordable for most Australians. For an individual living in inner Sydney on an average wage for that area, a mortgage on a median-priced home would now consume 76.5% of income.

Here’s another view of the same data. Inner-city mortgages in Sydney, Perth and Hobart as a proportion of income are above the national average; Melbourne, Brisbane and Canberra are below.

Across the greater-city areas, mortgage costs in Sydney and Canberra far outstrip all others.

Here, then, is the scoring for mortgage stress in the seven jurisdictions. New South Wales (6.25) is the worst; Queensland (2.5) is the least-bad:

WHICH STATE HAS THE WORST HOUSING CRISIS?
On the broad view of a large array of data, New South Wales has the worst housing crisis of any state or territory (with the exception of the Northern Territory, which is a special case). Queensland and South Australia are equal second-worst. The least-bad crisis is in the ACT.

